Art-specific growth samples are hard to come by. In fact, many schools simply throw something like a 5th Grade Band assessment example at the “Arts Teachers” (theater, music and visual arts) and consider that ‘sufficient’ – but it’s not good enough!
Let’s dig deep into student growth for art teachers. The following three steps (and corresponding charts) will have you writing an SLO in no time!
What Group Should I Measure for My Student Growth Goal?
Student growth data tracks individual student growth, which can be a shift in thinking. We often come up with lumped averages at the end of the year to show ‘student achievement’ as a whole in our school. Growth goals are specific to the student.
Look at the chart below. Here you can see four different models for growth, with an art-specific example off to the right. This chart will help you determine which students you will track for your growth goal. This can depend on what your state requires, or what you feel most comfortable with tracking.

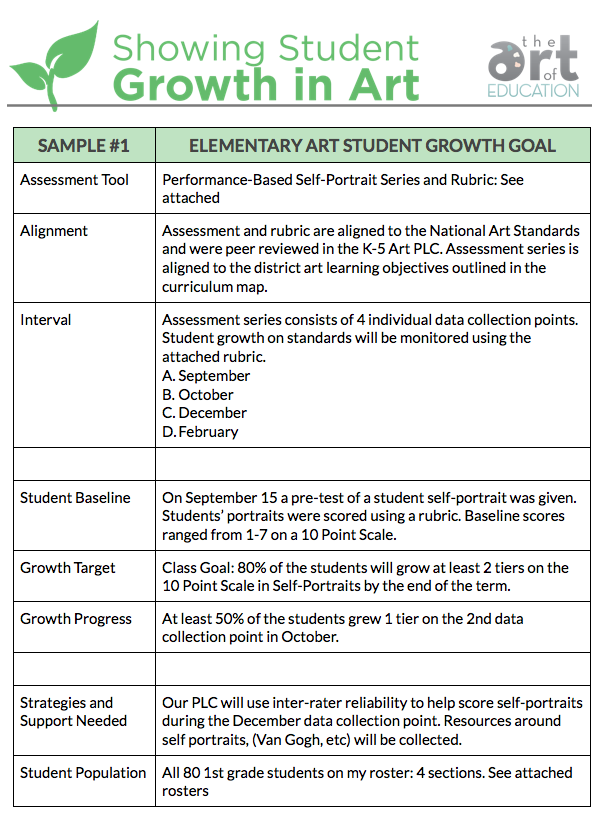
A Sample SLO for Art Teachers
Once you’ve chosen the group you will assess, think about the big picture. The sample SLO below shows an entire growth goal. Many of you are familiar with forms like this. Of course, you will want to check with your own specific school or state and use a template they require. The form below utilizes the ‘General’ model of growth from the chart above. Each student will be expected to grow “2 points” on the rubric from where they start at the pre-test. This allows for each student to have an individual, reasonable growth goal that is relative to his or her initial data.

Showing student growth can be a very simple process, but the big picture can be daunting. You must stay organized. The last piece of the puzzle is organizing all the data throughout the term so your final calculations are easy to obtain.
A Chart to Organize Your Growth Data
The chart below shows how you can see growth data for the entire class (including mid-point assessments) on one page.

Digitizing a chart like this with formatting that calculates for you is even smarter and will save you time (just find an excel genius in your school to help you!).
If you are looking for more tips on writing a solid growth goal, check out the article “3 Simple Tips to Make Tracking Student Growth Manageable” or consider taking AOE’s Online Grad Class “Showing Student Growth in Art,” where you can develop an entire SLO from start to finish. You will get an entire guide with your class registration that will include many more charts, examples, and resources like this – designed just for art teachers. We are running the class twice this summer!
What are some challenges you’ve faced tracking student growth this year?
What questions do you still have?
 This article was written by AOE Founder and President Jessica Balsley. Jessica is a passionate thought-leader in the field of Art Ed, and a tireless advocate of helping Art Teachers get the ‘Ridiculously Relevant’ PD they deserve.